Performance · 2024
Fieldnote dashboard, four times faster
A research dashboard that took four seconds to show anything. Two weeks later it showed the first chart in under one, without a rewrite.
- Client
- Fieldnote
- Role
- Performance rescue, two weeks
- Year
- 2024
- Stack
- React
- TypeScript
- Vite
- Vitest
The brief
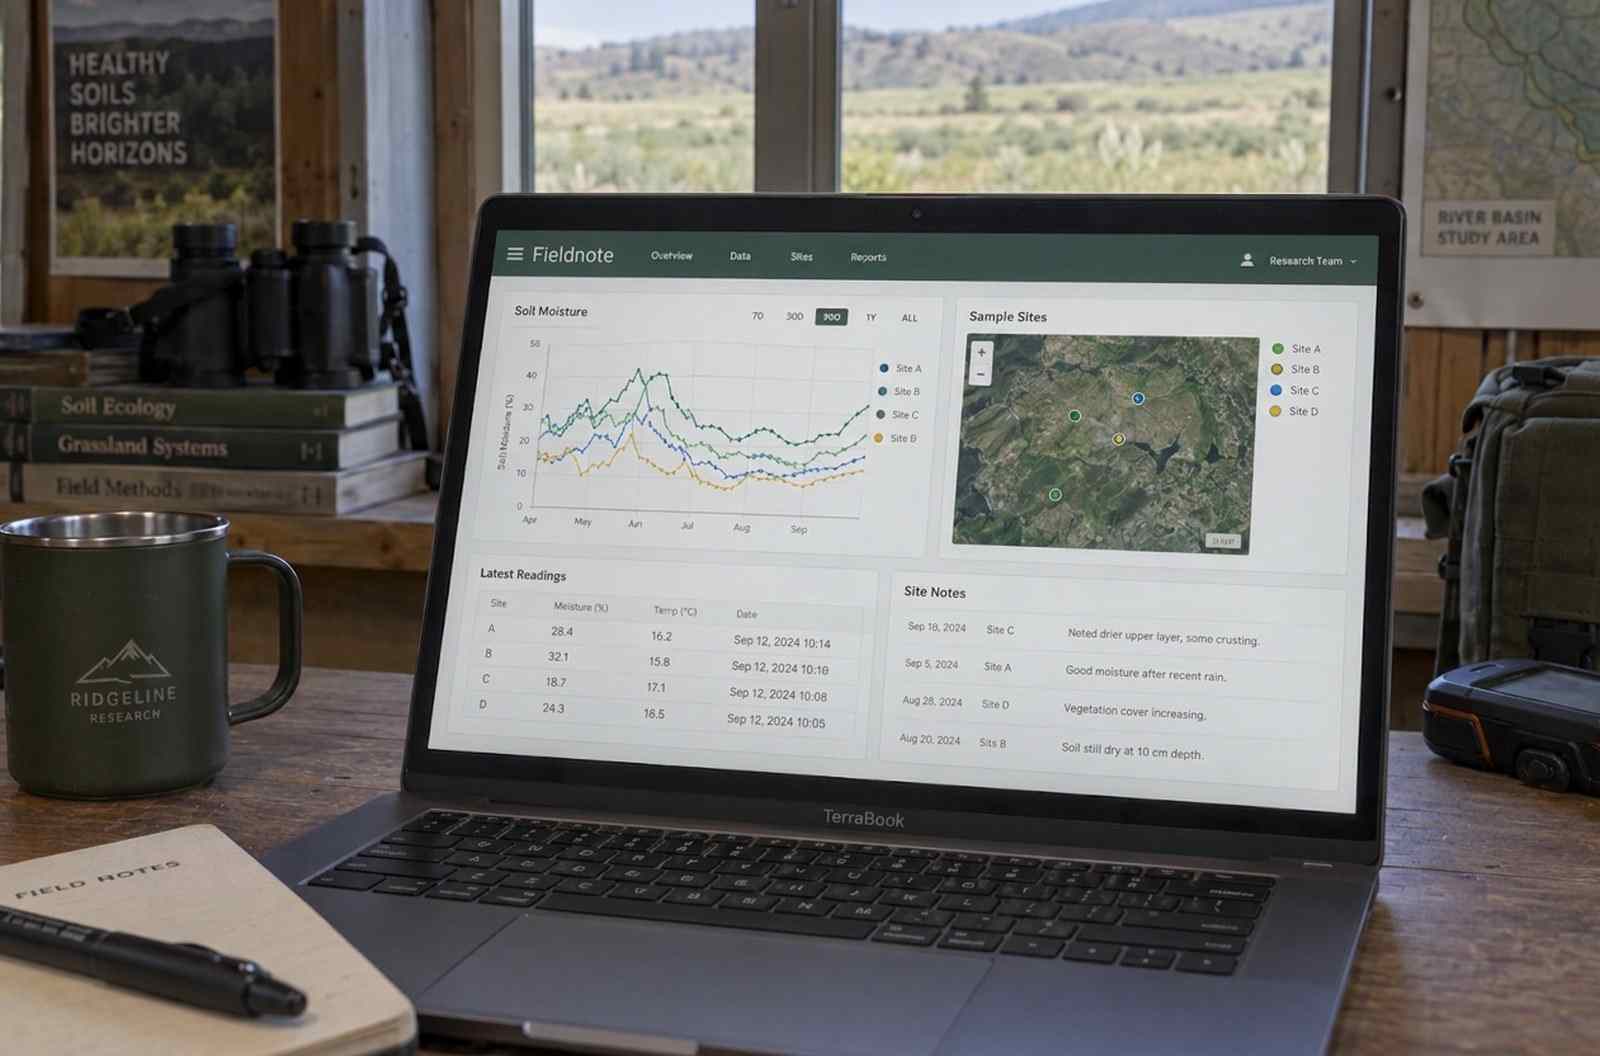
Fieldnote's customers are researchers who open the dashboard on a laptop in a field station with a slow connection. The app had grown into a single 2.1 MB bundle and the first chart took four seconds. They wanted it faster without stopping work on new features.
What made it hard
- No rewrite and no freeze on new features
- Older laptops and slow connections in the field
- Every change reviewed by the team, who keep the code afterwards
Results
- First chart
- Before: 4.1 sAfter: 0.9 s
- JavaScript on first load
- Before: 2.1 MBAfter: 380 kB
- Interaction to next paint
- Before: 420 msAfter: 90 ms
- Support tickets about speed
- Before: 12 a monthAfter: 1
How it was built
I measured before I touched anything: a week of real-user data, then the same three journeys on a throttled laptop. Most of the four seconds went into code that the first screen never used.
Split where people actually go
The bundle was split by route, then by panel. The chart library loads only with the first chart, the map only when someone opens it. The first screen now ships 380 kB.
Keep it fast
The last two days went into a performance budget that runs in CI. A pull request that adds more than 20 kB to the first load fails, with a link to what grew.
Screens
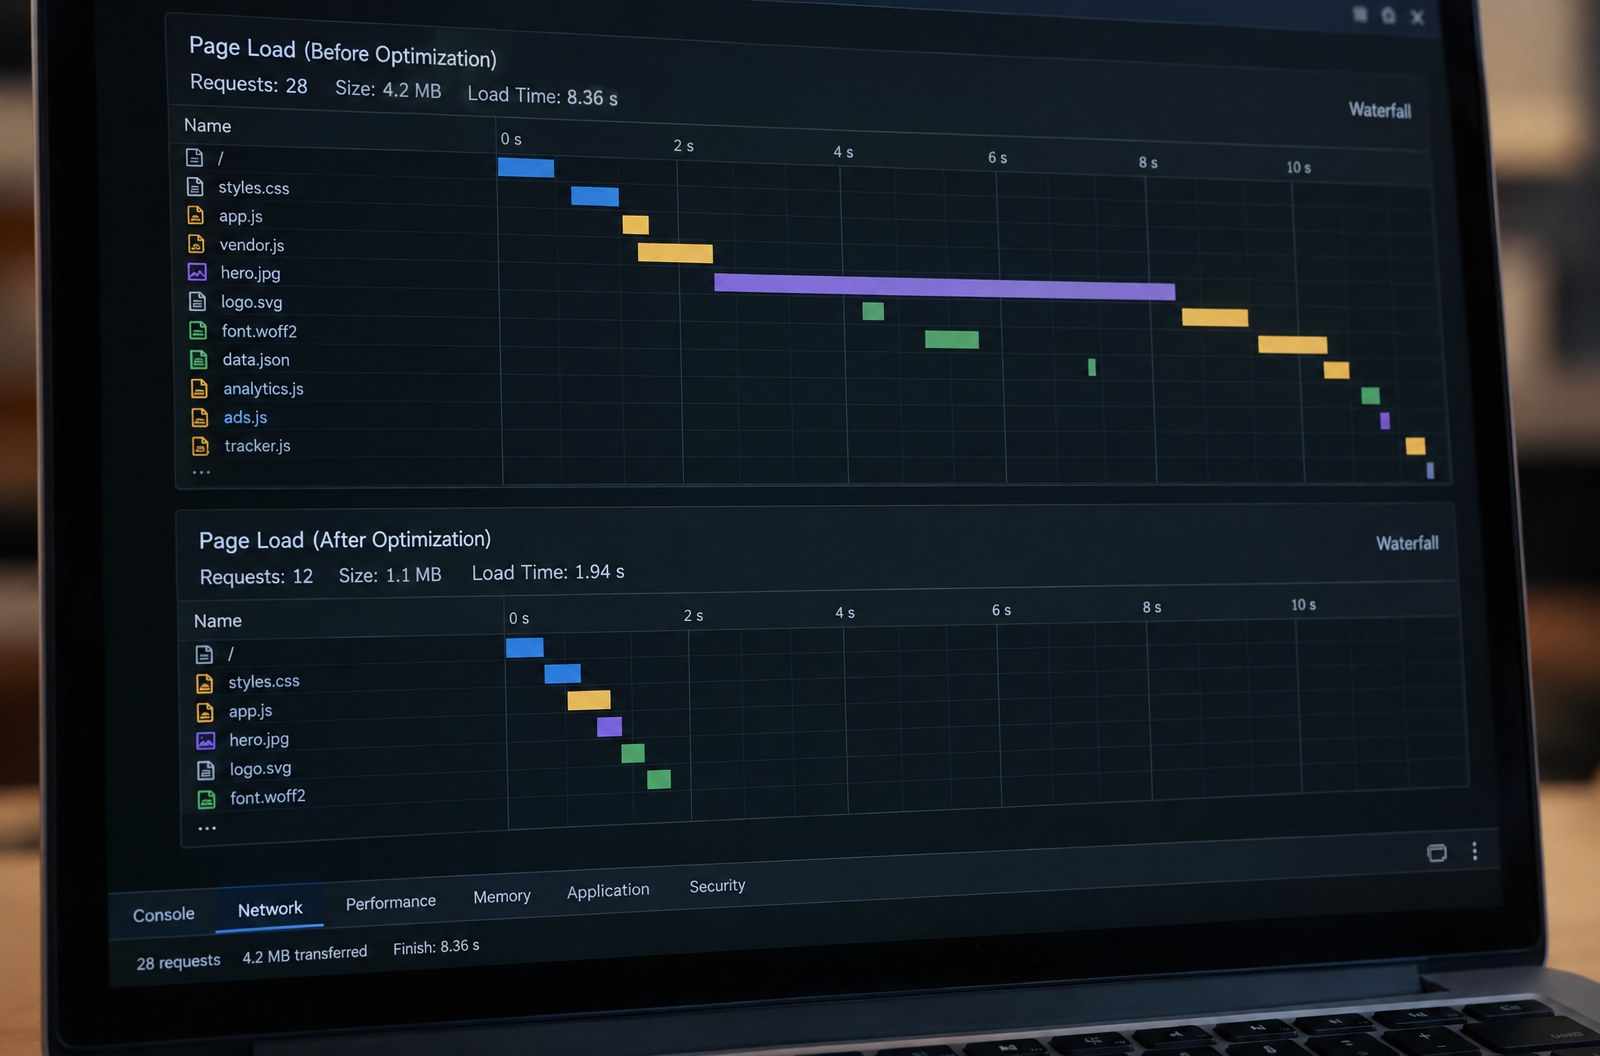
The first load, before and after.
Our dashboard went from four seconds to under one. Customers noticed before we told them.
Credits
- Team
- Fieldnote's front-end team of four